Planning a trip to Mexico City and wondering what the weather will be like? Understanding Mexico City Weather By Month is crucial for packing appropriately and making the most of your visit. This guide provides a detailed overview of the typical weather conditions you can expect throughout the year in this vibrant metropolis.
Mexico City, situated at a high altitude in the central Mexican highlands, experiences a unique climate. Unlike coastal regions, it enjoys a temperate climate with distinct wet and dry seasons. To give you the most reliable overview, our analysis is based on historical weather data and advanced meteorological models, ensuring accuracy and helping you plan your trip with confidence.
Average Monthly Temperatures in Mexico City
Temperature in Mexico City remains fairly consistent throughout the year, with mild to warm days and cool nights. Here’s a breakdown of average temperatures by month:
- January: Expect cooler temperatures, especially in the evenings. Average highs hover around 70°F (21°C), while lows can dip to 43°F (6°C).
- February: Similar to January, February remains cool and dry. Average temperatures are slightly warmer, with highs around 72°F (22°C) and lows around 45°F (7°C).
- March: Temperatures start to rise in March, signaling the approach of spring. Average highs reach 75°F (24°C), and lows stay around 48°F (9°C).
- April: April is pleasantly warm and dry, making it a popular time to visit. Expect average highs of 79°F (26°C) and lows of 52°F (11°C).
- May: May is the warmest month before the rainy season begins. Average highs can reach 81°F (27°C), with lows around 55°F (13°C).
- June: The rainy season typically starts in June. Temperatures remain warm, with average highs around 77°F (25°C), but expect increased rainfall and lows around 55°F (13°C).
- July: July is in the heart of the wet season. Expect daily rainfall, often in the afternoon or evening. Temperatures are mild, with highs around 75°F (24°C) and lows around 54°F (12°C).
- August: August continues the rainy season pattern, with frequent showers. Temperatures are similar to July, with highs around 75°F (24°C) and lows around 54°F (12°C).
- September: Rainfall begins to decrease in September, though showers are still common. Temperatures remain mild, with highs around 73°F (23°C) and lows around 53°F (12°C).
- October: October marks the end of the rainy season and the return of drier weather. Temperatures are comfortable, with highs around 73°F (23°C) and lows around 50°F (10°C).
- November: November is one of the driest and most pleasant months to visit Mexico City. Expect sunny days and mild temperatures, with highs around 72°F (22°C) and lows around 47°F (8°C).
- December: December is cool and dry, with festive holiday atmosphere. Average highs are around 70°F (21°C), and lows can drop to 45°F (7°C).
Rainfall and Wet Season in Mexico City
Mexico City experiences a distinct wet season, primarily from June to September. During these months, you can expect daily rainfall, often in the form of afternoon or evening showers. While the rain can be heavy at times, it usually doesn’t last all day, allowing you to still enjoy your activities.
The dry season, from October to May, is characterized by significantly less rainfall and sunny days. This period is generally considered the best time to visit Mexico City for pleasant weather and outdoor activities.
Data Sources for Mexico City Weather Information
Our weather analysis is based on a robust collection of historical data and advanced models. We utilize data from multiple weather stations in and around Mexico City to ensure accuracy. These stations provide essential ground-level readings that are crucial for understanding local climate conditions.
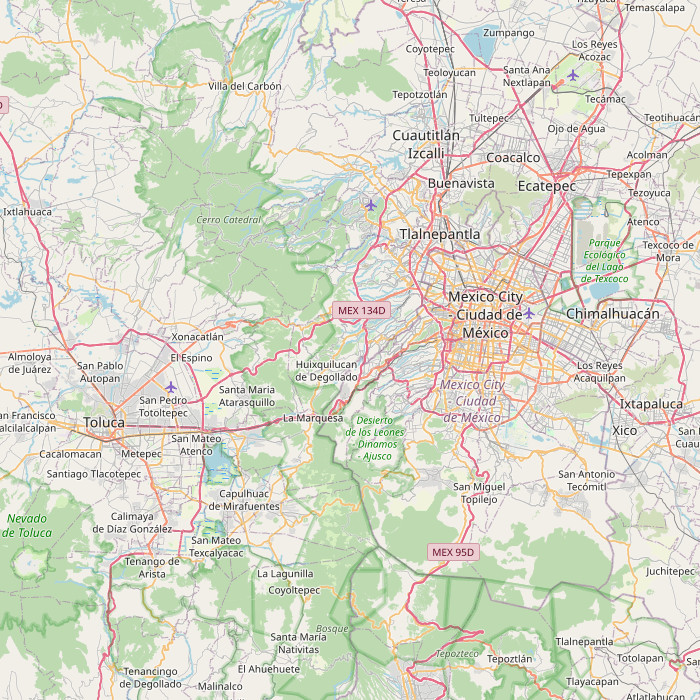 Map showing weather station sources around Mexico City for temperature and dew point readings
Furthermore, we incorporate data from NASA’s MERRA-2 Modern-Era Retrospective Analysis. This sophisticated reanalysis tool combines a vast array of measurements into a global meteorological model, providing a comprehensive hourly weather history across the globe. This allows us to reconstruct detailed weather patterns and ensure a complete picture of Mexico City’s climate.
Other data sources that contribute to our understanding of Mexico City’s weather patterns include the Global Land Cover SHARE database for land use information, the Shuttle Radar Topography Mission (SRTM) for elevation data, and GeoNames for location details. By integrating these diverse and reliable sources, we aim to provide you with the most accurate and helpful weather information for Mexico City.
Plan Your Trip to Mexico City Based on Weather
Understanding Mexico City weather by month is key to planning your ideal trip. Whether you prefer sunny and dry conditions or don’t mind some afternoon showers, knowing what to expect will help you pack accordingly and choose the best time to visit this amazing city. For the sunniest days and minimal rain, consider visiting during the dry season from October to May. If you appreciate milder temperatures and don’t mind occasional rain, the wet season can also be a beautiful time to experience Mexico City, with lush landscapes and fewer crowds.