Are you curious about the demographics of undocumented immigrants in the United States, particularly those from Mexico? At gaymexico.net, we understand the importance of having accurate and accessible information, especially when it comes to issues that affect our communities. This article breaks down the data and provides context on the evolving trends of immigration, offering insights relevant to the LGBTQ+ community and those interested in Mexican culture. Discover facts and resources to promote understanding and inclusivity.
1. What Is the Current Estimate of Unauthorized Immigrants in the U.S.?
In 2022, the unauthorized immigrant population in the United States was estimated at 11.0 million, according to the Pew Research Center. This number reflects an increase from 10.5 million in 2021, reversing a previous downward trend that occurred from 2007 to 2019. While it represents a recent increase, the 2022 figure is still below the peak of 12.2 million in 2007.
The Pew Research Center employs a “residual method” to estimate the unauthorized immigrant population. This involves subtracting the estimated number of lawful immigrants from the total number of immigrants residing in the U.S., utilizing data from U.S. censuses and government surveys such as the American Community Survey and the Current Population Survey. This methodology is consistent with that used by the U.S. Department of Homeland Security’s Office of Immigration Statistics and other organizations like the Center for Migration Studies and the Migration Policy Institute.
2. How Many Unauthorized Immigrants Are From Mexico?
In 2022, approximately 4.0 million unauthorized immigrants in the U.S. were from Mexico. This number is a significant decrease from the peak of 6.9 million in 2007. Despite the decline, Mexican immigrants still represent the largest single group of unauthorized immigrants in the United States, accounting for 37% of the total unauthorized immigrant population.
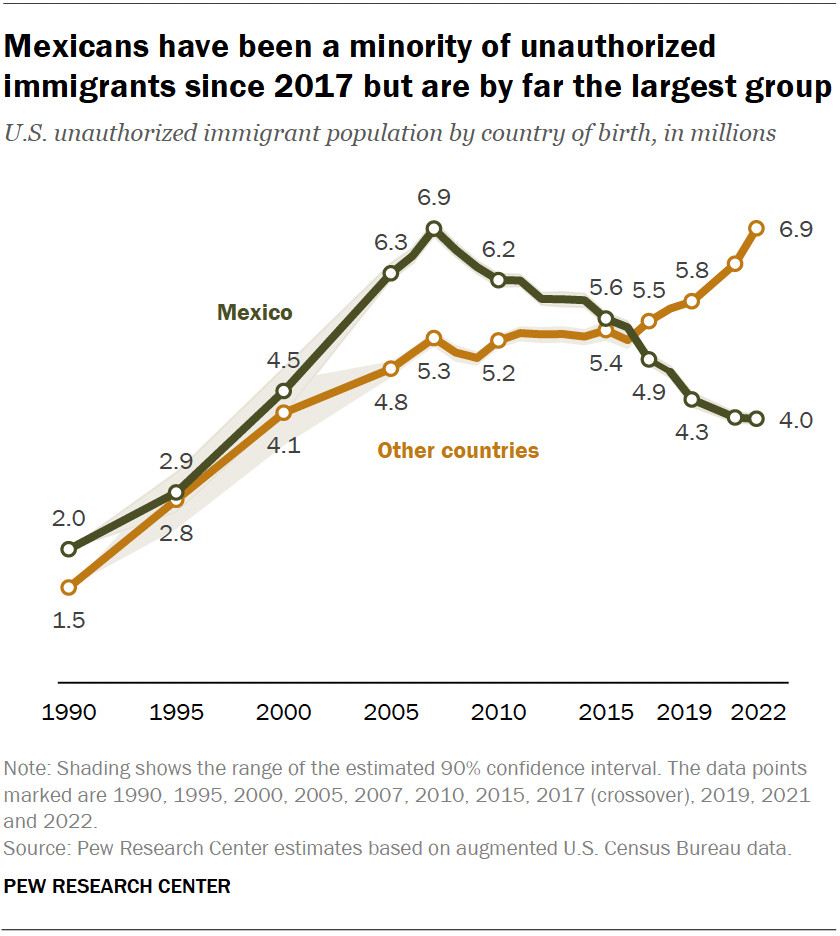 A line chart showing that Mexicans have been a minority of unauthorized immigrants since 2017 but are by far the largest group.
The decline in unauthorized immigrants from Mexico can be attributed to various factors, including:
- A decrease in overall migration from Mexico to the U.S.
- Some Mexican immigrants returning to Mexico.
- Expanded opportunities for legal immigration from Mexico, particularly for temporary agricultural workers.
3. What Percentage of All U.S. Unauthorized Immigrants Are Mexican?
Mexican immigrants make up 37% of the unauthorized immigrant population in the United States in 2022, which is the smallest percentage on record. This represents a significant shift from previous years when Mexican immigrants constituted a larger proportion of the total unauthorized immigrant population. The peak was in 2007 when they constituted 57% of the population.
The Pew Research Center notes that while the number of unauthorized immigrants from Mexico has decreased, the total number of unauthorized immigrants from other countries has increased. From 2019 to 2022, the unauthorized immigrant population from nearly every other region of the world grew, including the Caribbean, South America, Asia, Europe, and sub-Saharan Africa.
4. What Are the Primary Countries of Origin for Unauthorized Immigrants Besides Mexico?
In addition to Mexico, the countries with the largest unauthorized immigrant populations in the U.S. in 2022 include:
- El Salvador (750,000)
- India (725,000)
- Guatemala (675,000)
- Honduras (525,000)
These countries, along with Mexico, account for a significant portion of the total unauthorized immigrant population in the United States. The Pew Research Center’s data indicates a diversification of origin countries among unauthorized immigrants in recent years.
5. How Has the Composition of the Unauthorized Immigrant Population Changed Over Time?
The composition of the unauthorized immigrant population in the U.S. has changed significantly since its peak in 2007. While Mexico remains the top country of origin, its share of the total unauthorized immigrant population has decreased. Meanwhile, the number of unauthorized immigrants from other regions has increased.
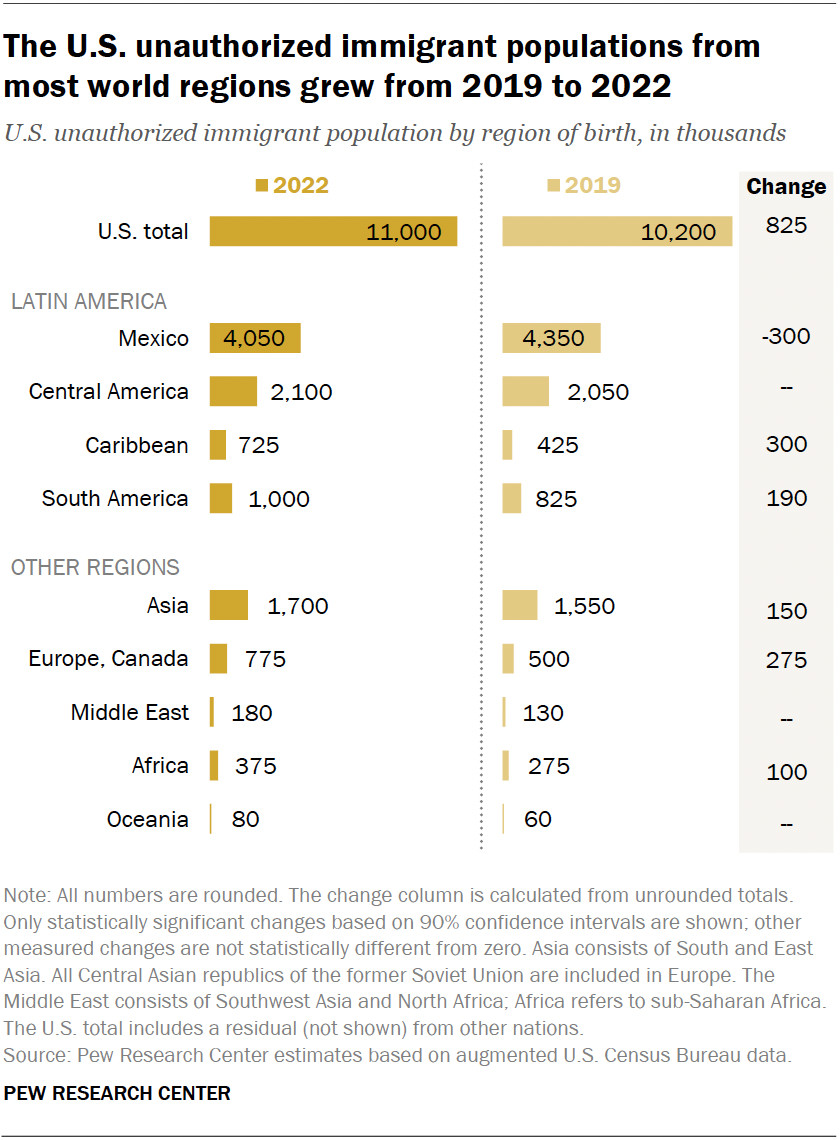 A bar chart showing that the U.S. unauthorized immigrant populations from most world regions grew from 2019 to 2022.
Between 2019 and 2022, the number of unauthorized immigrants from the Caribbean increased by 300,000, and those from Europe and Canada increased by 275,000. The Northern Triangle countries (El Salvador, Honduras, and Guatemala) saw significant growth between 2007 and 2019 but remained relatively stable after that. This shift indicates a broader global migration pattern affecting the U.S.
6. Which U.S. States Have the Largest Unauthorized Immigrant Populations?
As of 2022, the states with the largest unauthorized immigrant populations are:
- California (1.8 million)
- Texas (1.6 million)
- Florida (1.2 million)
- New York (650,000)
- New Jersey (475,000)
- Illinois (400,000)
These states have consistently had the largest unauthorized immigrant populations since at least 1980. However, the distribution has become less geographically concentrated over time. In 2022, these six states were home to 56% of the nation’s unauthorized immigrants, down from 80% in 1990.
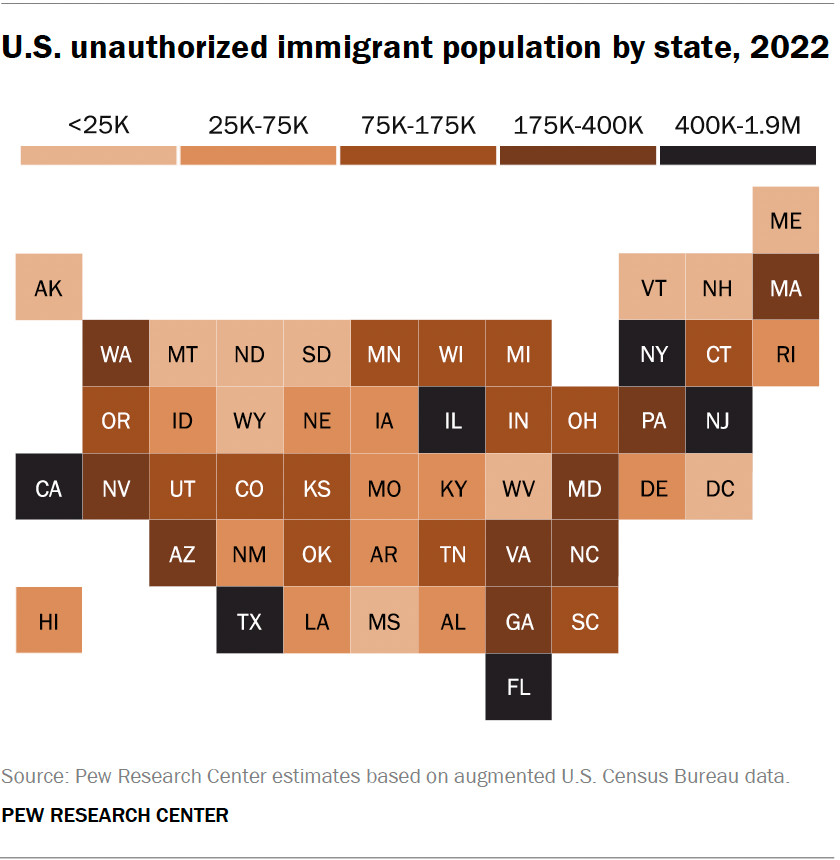 A heat map showing the U.S. unauthorized immigrant population by state, 2022.
Notably, California saw a decrease in its unauthorized immigrant population from 2019 to 2022, while Florida, Texas, New York, New Jersey, Massachusetts, and Maryland experienced growth.
7. How Does Temporary Protected Status (TPS) and Deferred Action for Childhood Arrivals (DACA) Affect These Numbers?
Temporary Protected Status (TPS) and Deferred Action for Childhood Arrivals (DACA) are programs that provide protection from deportation to certain unauthorized immigrants. Individuals with TPS can live and work in the U.S. because their home countries are unsafe due to war, natural disasters, or other crises. DACA allows unauthorized immigrants who were brought to the U.S. as children to live and work in the country.
As of July 2022, about 650,000 unauthorized immigrants had Temporary Protected Status, and approximately 595,000 were active DACA beneficiaries, largely from Mexico. These individuals are included in the overall estimate of unauthorized immigrants, even though they have temporary permission to be in the U.S. and are protected from deportation.
The Pew Research Center includes these individuals in their estimates because their status could change if government policy shifts. Additionally, many organizations and the federal government also include them in their estimates of the U.S. unauthorized immigrant population.
8. What Impact Do Asylum Seekers Have on Unauthorized Immigrant Statistics?
Individuals who have applied for asylum in the U.S. but whose cases have not been resolved are included in the unauthorized immigrant population estimates. There are two types of asylum claims: defensive and affirmative. Defensive asylum applications are filed by individuals facing deportation, while affirmative asylum claims are made by those not in deportation proceedings.
As of the end of 2023, the backlog of affirmative asylum cases had increased significantly, adding an estimated 870,000 immigrants to the backlog. The backlog for defensive asylum cases also grew, adding about 120,000 people. These asylum seekers are considered part of the unauthorized immigrant population because they have not been admitted as permanent residents.
9. How Has the Unauthorized Immigrant Workforce Changed in Recent Years?
The number of unauthorized immigrants in the U.S. workforce grew from 7.4 million in 2019 to 8.3 million in 2022. This number is similar to previous highs in 2008 and 2011. In 2022, unauthorized immigrants represented about 4.8% of the total U.S. workforce.
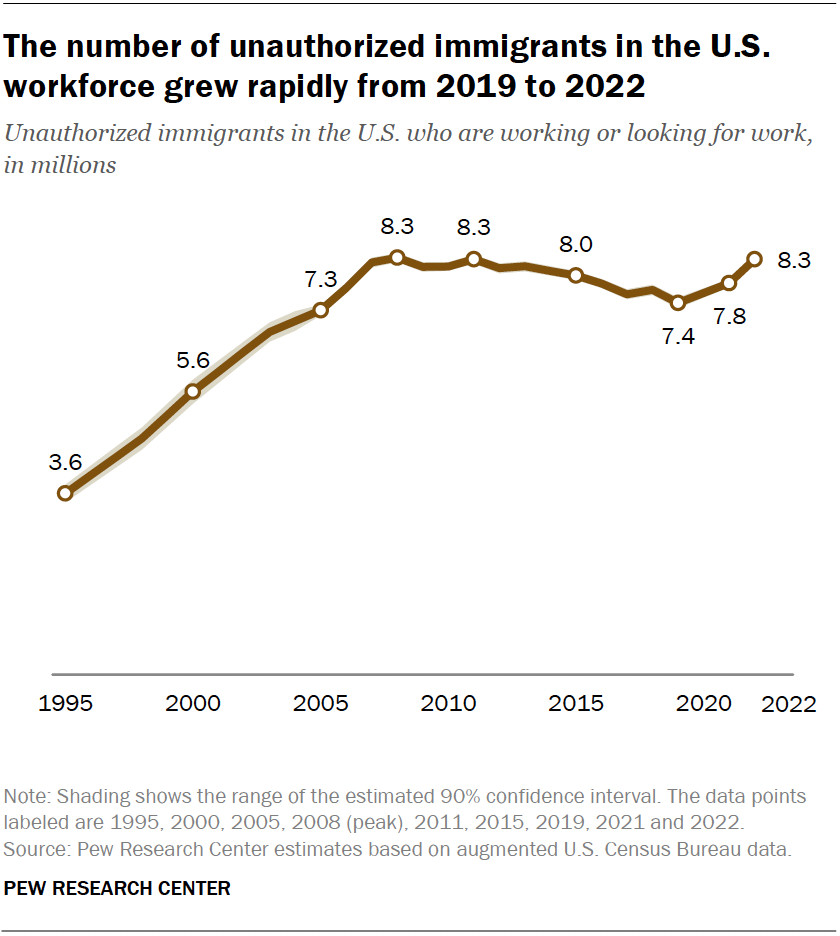 A line chart showing the number of unauthorized immigrants in the U.S. workforce grew rapidly from 2019 to 2022.
The share of unauthorized immigrants in the workforce varies by state. States with the highest shares include Nevada, Texas, Florida, New Jersey, California, and Maryland. In these states, unauthorized immigrants make up a significant portion of the workforce, contributing to various sectors of the economy.
10. How Do New Federal Programs Like CHNV and U4U Influence Unauthorized Immigration Numbers?
New federal programs such as the Cuban, Haitian, Nicaraguan, and Venezuelan (CHNV) parole program and Uniting for Ukraine (U4U) have influenced unauthorized immigration numbers. These programs allow individuals from specific countries to enter the U.S. on a temporary basis.
The CHNV program, which began in October 2022, allows eligible individuals from Cuba, Haiti, Nicaragua, and Venezuela to apply to enter the U.S. as parolees. By the end of 2023, approximately 320,000 new immigrants had entered the country under this program. Similarly, the U4U program, created in April 2022, allows Ukrainian citizens and their families to live in the U.S. temporarily. As of January 2024, over 175,000 Ukrainians had been admitted on a two-year parole.
Because these immigrants are not admitted for permanent residence, they are included in estimates of the unauthorized immigrant population. The Pew Research Center notes that while these programs have increased the number of people entering the U.S., it is difficult to determine the exact impact on the overall unauthorized immigrant population due to factors such as outmigration, deaths, and transitions to lawful immigration statuses.
11. What Is the Significance of the Census Bureau’s Updated Estimates?
In December 2024, the Census Bureau released updated population estimates indicating that immigrants have been underrepresented in official population estimates used for the 2022 and 2023 American Community Surveys (ACS). These new estimates show that the U.S. population was larger than previously thought, with nearly all of the additional people being immigrants, most of whom are considered unauthorized immigrants.
The Census Bureau’s updated estimates have implications for understanding the true size of the unauthorized immigrant population in the U.S. The Pew Research Center acknowledges that their estimates for 2022 are lower than the bureau’s new estimates and is working to update their figures to align with the latest data.
12. Where Can I Find More Information About LGBTQ+ Life and Travel in Mexico?
Looking for more than just immigration statistics? Discover the vibrant LGBTQ+ scene in Mexico with gaymexico.net. We offer comprehensive guides to the best destinations, events, and accommodations for LGBTQ+ travelers. Whether you’re planning a trip or seeking to connect with the LGBTQ+ community in Mexico, gaymexico.net is your go-to resource.
At gaymexico.net, we are committed to providing accurate and accessible information to help you understand the complex issues surrounding immigration and the LGBTQ+ community. We hope this article has been informative and encourages you to explore our website for more resources.
Ready to explore Mexico? Visit gaymexico.net today for detailed travel guides, event listings, and community connections!
Address: 3255 Wilshire Blvd, Los Angeles, CA 90010, United States
Phone: +1 (213) 380-2177
Website: gaymexico.net
Frequently Asked Questions (FAQs)
1. What defines an unauthorized immigrant in the U.S.?
An unauthorized immigrant is defined as any immigrant not admitted for lawful permanent residence, including those who have entered the country without permission or those who have overstayed their visas.
2. How does the Pew Research Center estimate the number of unauthorized immigrants?
The Pew Research Center uses a “residual method” that subtracts the estimated number of lawful immigrants from the total number of immigrants residing in the U.S., based on data from U.S. censuses and government surveys.
3. Has the number of unauthorized immigrants from Mexico increased or decreased in recent years?
The number of unauthorized immigrants from Mexico has decreased from a peak of 6.9 million in 2007 to approximately 4.0 million in 2022.
4. What percentage of the total U.S. population do unauthorized immigrants represent?
Unauthorized immigrants represented approximately 3.3% of the total U.S. population in 2022.
5. Which states have seen the largest increases in their unauthorized immigrant populations recently?
From 2019 to 2022, Florida, Texas, New York, New Jersey, Massachusetts, and Maryland saw significant growth in their unauthorized immigrant populations.
6. How do programs like DACA and TPS affect the unauthorized immigrant population?
Programs like DACA and TPS provide temporary protection from deportation to eligible individuals, who are still counted in the overall estimate of unauthorized immigrants.
7. Are asylum seekers included in the unauthorized immigrant population estimates?
Yes, individuals who have applied for asylum but whose cases have not been resolved are included in the unauthorized immigrant population estimates.
8. What is the impact of new federal programs like CHNV and U4U on unauthorized immigration?
New federal programs like CHNV and U4U have allowed individuals from specific countries to enter the U.S. on a temporary basis, contributing to the overall number of non-permanent residents.
9. How many unauthorized immigrants are in the U.S. workforce?
Approximately 8.3 million unauthorized immigrants were in the U.S. workforce in 2022, representing about 4.8% of the total workforce.
10. What are the implications of the Census Bureau’s updated population estimates for unauthorized immigration figures?
The Census Bureau’s updated estimates suggest that immigrants have been underrepresented in previous population estimates, indicating that the unauthorized immigrant population may be larger than initially thought.